WHAT WE DO
THE NEXT ELECTION
In 2015 between May and October Argentina will hold 70 elections, an average of one each 3 days. So much information needed to be ordered in some way! Together with Patmos we developed an easy to understand app to show how many days are left for the next election to be held, where and what is at stake.

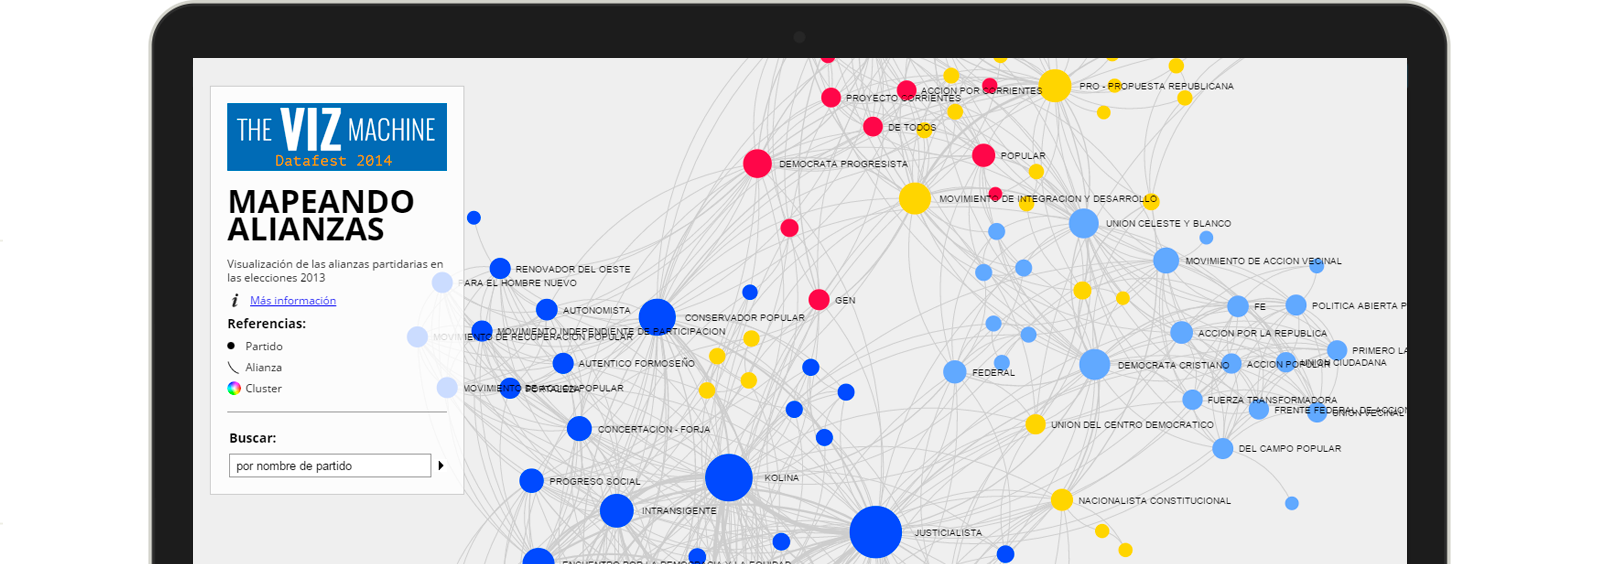
MAPPING ELECTORAL ALLIANCES
An interactive visualization of the alliances between political parties that run for the 2013 Congress elections in Argentina. The graph shows in a simple and innovative way the complexity of the relations between parties (who allies with whom and how often) bringing really relevant information for the citizen to vote. Yhis project was awarded with the second prize at Datafest 2014, a hackaton for Data Journalists.
#KarinaEnElLunaPark
Karina is one of the most popular singers in Argentina. On May she gave a concert in the Luna Park, a mythical venue for latin american artists. We built an interactive live Twitter feed to engage the audience during the pre show. More than ten thousands Karina´s fans could participate actively in the show by sending their photos and twitts using the hashtag #KarinaEnElLunaPark which then were projected in a big screen.

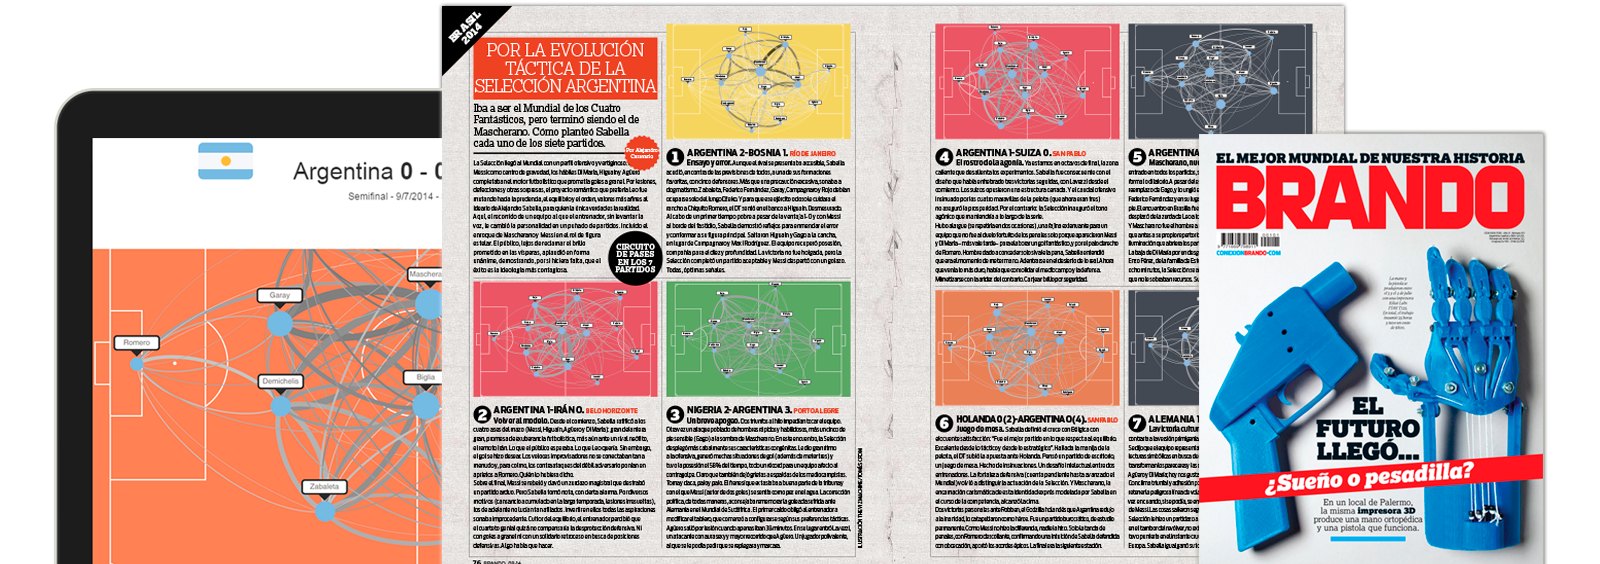
ARGENTINA'S BALL PASSING
An interactive tour through the seven games of Argentina in the Brazil 2014 World Cup that shows between whom the players passed the ball and how often. An innovative way for journalist to analyze games and supporting their point of view. The graph shows the importance of Messi in the first round and of Mascherano in the final games. This visualization was ublished by Brando Magazine.
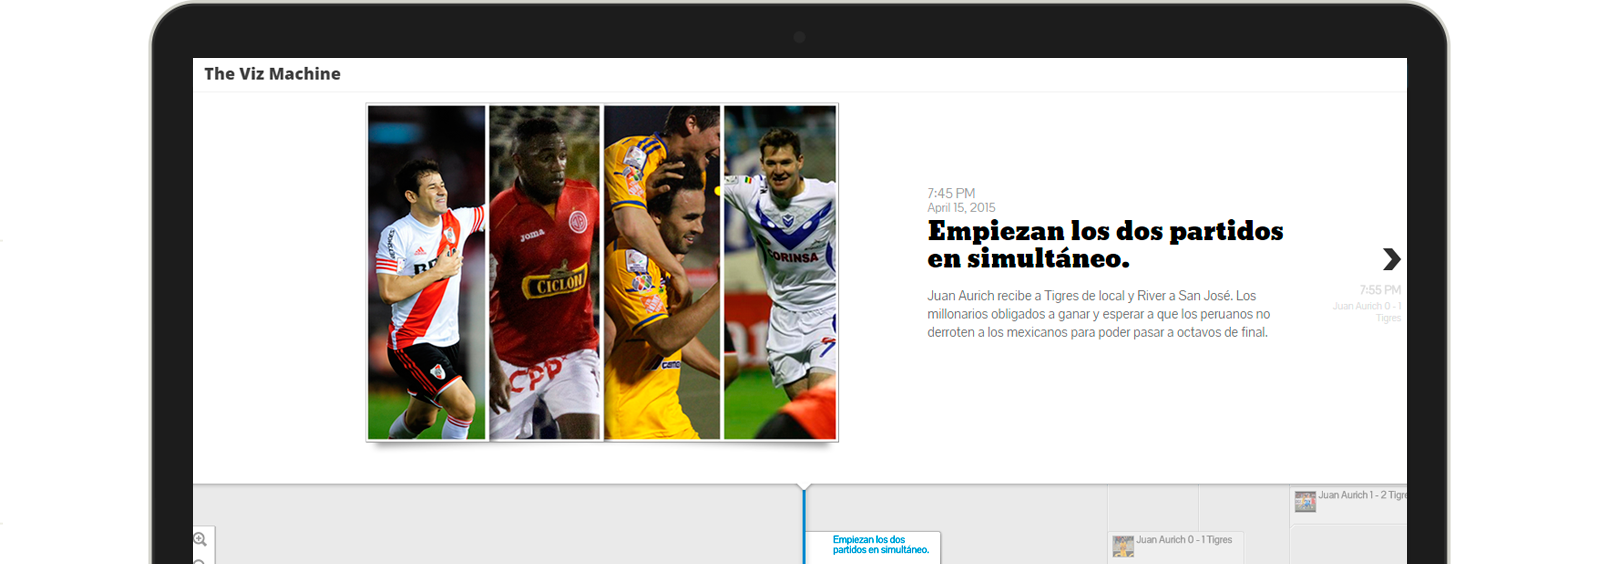
RIVER PLATE, TO 1/8 DRAW
Interactive timeline to follow and revive both South American Libertadores Cup 2015 Cup games simultaneously, River Plate (ARG) vs. San José (BOL) and Juan Aurich (PER) vs. Tigres (MEX) that led to the agonal classification of argentinean team to the next draw.